
Your Best Seller Might Be Your Worst Earner
I learned this the hard way from a restaurant I manage.
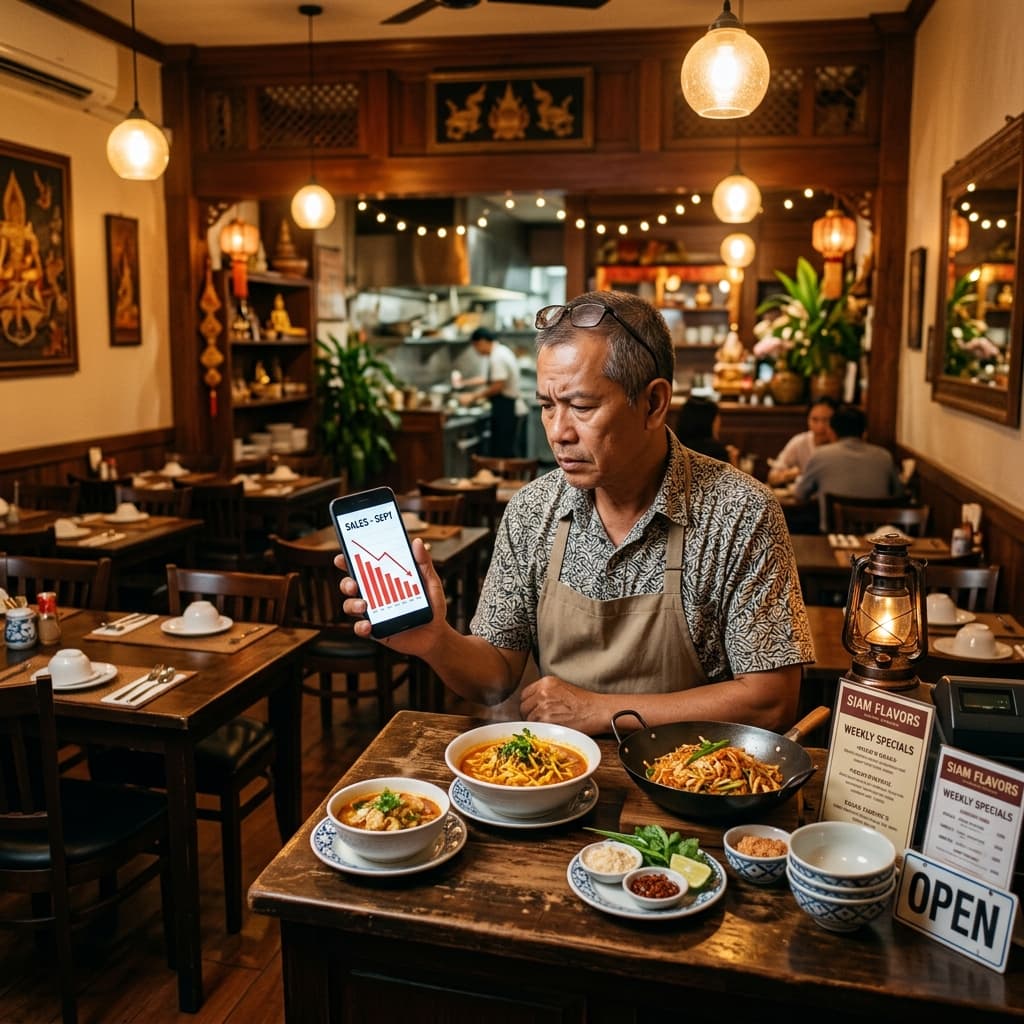
One dish sold every single day. Customers ordered it all the time. But when I looked at the actual cost — the profit per plate was almost nothing, because the ingredients were expensive and the portion was too generous.
Meanwhile, another dish barely got ordered, but the profit per plate was massive — low cost, high perceived value.
The problem is you don't know which dish falls into which category until you have the data.
Tools I Actually Use
Primary tools:
- Claude Code — feed it sales data + ingredient costs, and it runs the full Menu Engineering Matrix analysis for every item
- Google Sheets — store menu data, sales volumes, and costs as input for AI
- Airtable — if you already have a menu database, just export and use it
Alternatives if you don't use Claude Code:
- ChatGPT + Excel — keep data in Excel, copy-paste it to ChatGPT for analysis
- Google Sheets + Gemini — use the built-in Gemini AI right inside Google Sheets without leaving the app
The Menu Engineering Matrix
Menu Engineering analyzes every dish across two dimensions:
- Popularity — how often does this item get ordered?
- Profitability — how much profit does it make per plate?
Plot these two dimensions and you get a matrix with 4 quadrants:
Star — High Popularity + High Profit
The dream dish. Customers love it and it makes you money.
What to do: Promote it aggressively. Place it in the prime spot on your menu (top-right corner or center of the page). Photograph it beautifully. Feature it in ads. Don't raise the price unless you absolutely have to.
Plow Horse — High Popularity + Low Profit
The dish everyone loves but quietly drains you. You produce a lot of it, but the margins are thin.
What to do:
- Cut costs — tweak the recipe, slightly reduce the portion, find substitute ingredients
- Raise the price gradually. If demand doesn't drop, people are willing to pay more.
- Pair it with high-margin side dishes to bump up the average check
Puzzle — Low Popularity + High Profit
The hidden gem. If more people knew about it, it would help your bottom line significantly. But right now, it flies under the radar.
What to do:
- Reposition it on the menu — make it more visible
- Rename it — give it a name that sounds more appetizing
- Have staff recommend it — "I'd really suggest this one today"
- Bundle it with a Star to encourage trial
Dog — Low Popularity + Low Profit
The menu item that's just taking up space. It makes the menu longer without adding value.
What to do: Remove it. Don't be sentimental. A shorter menu makes it easier for customers to decide, and reduces complexity in the kitchen.
The Process: Export > Analyze > Action Plan
Step 1: Export Sales Data from POS
Most POS systems let you export sales reports by menu item. Look for Reports > Sales by Product > export as CSV or Excel.
Data you need per item:
- Dish name
- Orders per month
- Selling price
- Ingredient cost per plate (if available — a rough estimate works too)
Step 2: Organize Data in Google Sheets
Set up a simple table:
| Dish | Orders/Month | Selling Price | Cost/Plate | Profit/Plate |
|---|---|---|---|---|
| Dish A | 320 | $6.00 | $3.20 | $2.80 |
| Dish B | 280 | $5.00 | $4.30 | $0.70 |
Step 3: Send the Analysis Prompt to AI
Menu Engineering Matrix prompt:
Analyze these menu items using the Menu Engineering Matrix.

[paste your Google Sheets data here]

Analysis steps:
1. Calculate Gross Profit per plate for every item (if not already in the data)
2. Calculate average popularity (order volume) and average profitability (profit/plate)
3. Classify each item as: Star / Plow Horse / Puzzle / Dog
   - Star = above-average orders + above-average profit
   - Plow Horse = above-average orders + below-average profit
   - Puzzle = below-average orders + above-average profit
   - Dog = below-average orders + below-average profit

Output: full table with every item + classification + specific recommendation for each.
Step 4: Have AI Generate a Prioritized Action Plan
Pricing and positioning prompt:
Based on the Menu Engineering Matrix above, create an action plan for a restaurant owner.

Goal: maximize total profit without increasing customer count.

Recommend:
1. Which items to raise prices on — by how much, and why
2. Which items to cut costs on — how (portion / ingredients / recipe)
3. Which items to reposition on the menu — where to move them
4. Which items to remove — and why
5. Which items to bundle together — how to structure bundles for better margins

Rank by impact, highest first. For each action, estimate the approximate profit increase in %.
AI Does the Analysis from Real Data
Before, doing this matrix meant manual Excel work — pulling sales data, calculating cost per plate, plotting graphs by hand. Half a day minimum.
Now I send AI two things:
- Sales data — order count per item per month
- Ingredient costs — cost per plate
AI will:
- Calculate Gross Profit per plate for every item
- Compare against averages and assign each dish to its quadrant
- Generate an Action List for what to do with each item
- Rank by impact — which dish to fix first
Example Output
| Dish | Orders/Month | Profit/Plate | Category | Recommendation |
|---|---|---|---|---|
| Dish A | 320 | $2.80 | Star | Feature on menu front page |
| Dish B | 280 | $0.70 | Plow Horse | Adjust recipe, cut cost by 15% |
| Dish C | 45 | $4.00 | Puzzle | Reposition, reshoot photos |
| Dish D | 12 | $0.60 | Dog | Remove from menu |
With just two sets of data — sales and costs — AI runs this entire analysis in 5 minutes.
More Profit Without Selling More
The exciting thing about Menu Engineering is that you don't need new customers. You don't need more ad spend. You just need to manage the menu you already have more intelligently.
- Turn Dogs into Puzzles by adjusting pricing and positioning
- Make Plow Horses more profitable by reducing costs
- Promote Stars so people order them more
In my own restaurant, just removing 4 Dogs and repositioning 2 Puzzles led to higher orders per table and a bigger average check — with the exact same number of customers.
The Bottom Line
A menu isn't just a list of dishes. It's a money-making tool that should be designed with data.
The Menu Engineering Matrix sorts items into 4 groups — Star, Plow Horse, Puzzle, Dog — each with a different playbook.
AI can run this analysis from the sales and cost data you already have. You don't need to be a data analyst to do this.